Showing posts with label Metrics. Show all posts

Monday, April 06, 2015

Three Reasons Anecdotes Often Distort Reports

Probably as an attempt to make an already interesting chart in a report I read last week seem even more interesting, someone penciled in the names of a few events.

The notations seemed to suggest anecdotal explanations for a change over last year in passenger growth at the airport jointly owned by Durham, North Carolina, the community where I live.

This is often done in reports made for general consumption either through a lack of understanding of data analysis, or as I will show later, due to the discomfort human beings have with randomness.

Some of the notations in the airport’s report made sense, such as when a significant number of flights were cancelled over the course of several days due to bad weather.

Some made less sense such as when a few direct west coast flights were added.

And notations attributing increases to community events made no sense at all.

While the events were significant to the communities where they were held and surely filled some airline seats, it is questionable that they were each the reason for a bump in traffic for two months.

If they were, the increase in those months would be reflected by a drop in the month following.  Instead the percentage of increase continued without the events.

An “inconvenient truth” for communities hosting the Super Bowl, the mother of all mega-events, is that sales tax collected across those dates varies little from the year prior and the year after.

There are at least three reasons mistakes such as these occur.

Often it is deliberately done as a community relations gesture to please a few stakeholders or even more often, to help justify the hyperbole they have generated around an event. 

Humorously, one community event proclaimed one year that airlines would add flights due to an event to be held shortly after a new terminal was set to open.

The news media is complicit in this hyperbole or else a follow up story would have noted that neither the number of flights nor passenger load factors increased, signaling that the event may have created displacement which would have also lessened its overall economic impact.

Seth Godin recently wrote, “Human-beings are story-making engines, and when we’re confronted with randomness, we make up an egocentric version of what happened and it involves us.”

Applicable to the explanations penciled on that chart I read, he continues with, “Here’s the truth.  There is no reason.  That’s why we define it as random.”

More on randomness as it involves analysis of data later.

I saw the fascination people have with anecdotes during some of my board meetings in my former life in community destination marketing.

Often after seeing a change in a metric that had been generated such as aggregating and comparing hotel occupancies community-wide, a member, seeking an anecdote-fix, would inevitably turn to another who operated a hotel and ask “Is that what you saw?”

Others would leap to conclusions that it was due to a major event,  even though it would take an event many times larger or a phenomenal increase in events overall that month to move that particular needle, and by doing so, would create displacement.

Of course, even in communities that also had access to this data, a community-destination organization (DMO) may be complicit if it is one of those places that subsidizes events to be held there.

Even where they should know better, this can often happen because organizations in a community want to please those excited by the event, but more often it is because they are careless with data analysis or just want to sell sponsorships.

This has happened in the last few weeks as communities hosted NCAA basketball playoff games across the country.  Often, to calculate impact, they would factor in hotels rooms used without deducting for the percentage that would have been filled anyway.

Or they would extrapolate spending estimates without factoring in the number of day-trip vs. overnight attendees and/or without factoring attrition as teams lost and fans returned home when it was too late to retrieve visitors who had been displaced by the event.

Communities are often guilty of grossing up estimates without netting out displacement and leakage when displacement pushes the impact off into nearby communities, or worse, crowds out the flow of air travelers who would have visited those communities for other purposes.

News reporters become enablers either out of enthusiasm for events or because they do not understand the nature of economic impact, unwittingly misleading officials in other communities to go down the same path without rationale based on good analytics.

The reason misattribution of impact occurs involves data analysis itself.  A white paper entitled “The 5 Common Mistakes People Make In the Name of Statistical Analysis,” is available from Mu Sigma, one of the world’s largest decision sciences and analytics firms.

One is “extracting meaning out of randomness.”  Data analysis is the process of looking for meaningful patterns.  This process involves isolating patterns from “noise” which in statistics refers to a “random phenomena” that is “beyond the control of your organization or even known external factors.”

So the penciling on that chart might be a case of what data analysts call the “Problem of Overfitting.”

This is just one observation from an otherwise excellent report that if harvested by any of the five dozen destination communities pushing and pulling traffic through the airport will be immensely valuable, especially to community-destination marketing organizations.

More than half of the airport enplanements are visitor-related.  The report breaks down the top market areas for 2014 including 610 passengers daily via the airport in Boston, 590 via New York-LaGuardia and another 330 via New York-Kennedy.

Those new flights to LA and San Francisco added to non-direct flights carried 594, probably not enough to make a dent where penciled in as the reason for a bump in numbers overall a year ago.

More than 9.5 million passengers transit through RDU International Airport during the course of a year.  That’s about 26,000 a day, 13,000 of whom are visitors either arriving or returning home.

Even for Durham which draws 33% of the visitors who arrive via RDU, a greater proportion than any other city and the equal of Wake County which includes Raleigh, air travelers represent only 8% of visitors traveling from at least 50 miles away, a point shy of the national average and double that of North Carolina.

But from the time I took my first International flight in 1967 as a college kid and when I retired in 2009 after a four-decade career in community destination marketing, the metric for passenger revenue miles worldwide has increased by 18 times.

But the metric for global air cargo miles had increased by more than 22 times.

Of just as much significance to North Carolina's brand though is that RDU represents 5,000 acres, including impeccably maintained natural areas along roadways maintains.

But half is open space unusable for any future aviation needs.

There will be incredible pressure, unfortunately some of it created by airport stewards, to convert much of that land from open space, trees, streams and park-like land into development and impervious surface instead.

Hopefully, any thinking in that direction will factor in the ecosystem services provided by that open space, giving as much consideration for green infrastructure as tarmac.

Very few cities encompass an airport.  Instead, most airports, such as RDU are surrounded by numerous, distinct cities.

The surrounding cities draw travelers through the airport doubling the size justified by their collective populations.  But on average, airports also distribute a third of the value of all of the products we consume.

RDU is at the center of an Aerotropolis, a term coined by Dr. John Kasarda who heads the Center for Air Commerce at UNC-Chapel Hill.

As such, RDU is well advised to remember that it is also the town square for this vast, multi-city Aerotropolis

Monday, March 30, 2015

Anecdotal Madness

I held this post back for a few days so it wouldn’t appear to be rubbing salt into places where pride was so freshly wounded.  But this post is about more than just the Final Four or college basketball.

Sports reporters, especially in North Carolina where so many learned the basics in journalism at UNC-Chapel Hill, often repeat a myth that just has never held up to scientific scrutiny.

It found its way into several stories written last night after Duke became the fourth finalist: that Duke is the basketball team people love to hate.

It was so pronounced, that beginning in the early 1990s, Durham’s newly established community marketing organization used it as inspiration for one of a handful of markers as it set out to pin down and resolve misinformation undermining the community’s image.

Repeatedly over the years, polls showed that Duke’s highly successful men’s basketball program was not only the most popular in Durham, but a very close second in UNC’s home county.

Coincidentally, at the same time a national poll by Harris found that Duke was America’s favorite men’s basketball team, a position it has held now for 12 of the last 18 years including 2015.

In the six years when it was not America’s favorite, it was 2nd most favorite five of those years, falling to third one year, 1997.

The University of North Carolina was most favored three of those years giving the metro area centered around Durham and Chapel Hill a very unique status.  UNC has averaged just below #3 while Duke has averaged #1.

Kentucky has averaged just a bit more popular than UNC, possibly leading to a Kentucky-Duke culmination of this year’s Final Four dominating brackets across the country.

But what about here in the state of North Carolina?

I watched newcomers to Durham from Michigan stop by a table of Duke football players having breakfast this weekend to josh that Duke would be their new fav when a man nearby jumped from his chair, interrupting a phone call and a mouthful to scream, “no in North Carolina, it is the Tar Heels.”

However, he wasn’t joshing.

Walking away, the newcomers were puzzled and other patrons just looked down.  He may have been right about football, but probably not for long.

But what do metrics show regarding basketball?

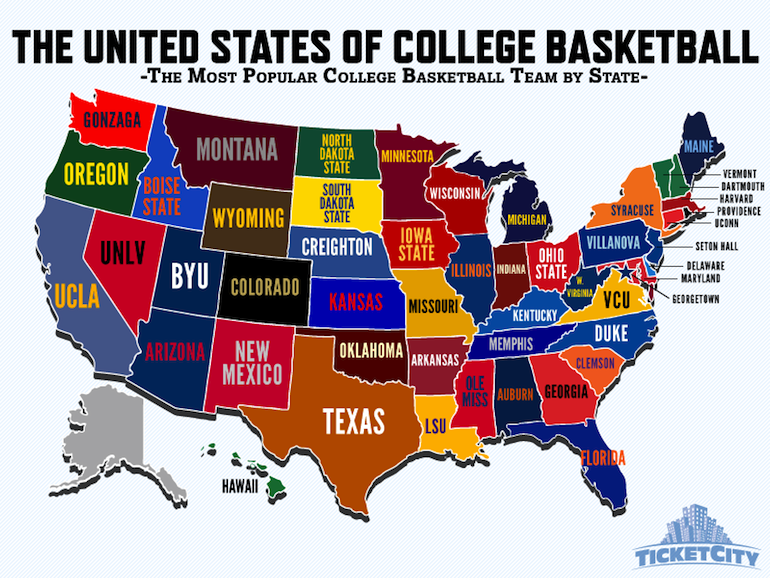
TicketCity, an agency founded in 1990 by a University of Texas grad took a look at which teams scored highest for engagement in their own state, factoring game attendance, Google search and social media over the past year.

Here Duke came out #1 too, in the North Carolina.  BYU was tops for Utah and Gonzaga for Washington, giving me an added alumnus trifecta.

All of this does not negate that Duke might also be hated, which is a different metric altogether, just that it would be irrelevant without showing it in the context of overwhelming popularity.

Sports reporters are emblematic of the challenges that face news reporters overall.  Drawing anecdotes as evidence of a more generalizabe public opinion is very tricky.

Local news in Durham has inferred that its recent population growth is due to the turnaround of downtown Durham in the last few years.  But Durham was the fastest growing city in North Carolina throughout the 1990s when its downtown had yet to emerge and its image underwent a turnaround.

How could this be?  Because Durham’s self-image and its image nationwide has always been high.  Over the 1990s is when negativity about Durham entrenched in surrounding counties was gradually reversed.

For sure, the image turnaround by 1999 lowered one of the barriers key to downtown revitalization by opening the minds of the news media, realtors, developers, financiers, as well as newcomers.

But downtown revitalization was also spurred both here and across the nation after the year 2000, not just by favorable shifts in psychographic and demographics but even more so by the innovation that year of New Market Tax Credits (NMTC.)

NMTC’s were recognized by Harvard in 2009 as one of the nation’s most innovative government programs leading to this 2010 case study of their dramatic success in downtown Durham.

Studies, scientific polls and generalizable metrics may not be as exciting as hyperbolic anecdotes for news reports or news consumers more interested in the pursuit of legends and myths, including their own.

But these tools are crucial to any community seeking a factual basis upon which to truly shift perceptions and initiate change.  Studies, polls and metrics are also important when assessing which coattails to ride or credit.

There is no institution more deserving of credit for everything Durham has achieved than Duke, and no program there more deserving of enhancing Durham’s reputation than Coach K’s Blue Devils.

Friday, January 23, 2015

Failing to Account for Changes in Consumer Behavior

Analysis of data gathered as part of the Survey of Public Participation in the Arts shows that Americans attending performing arts performances dropped from 39% in 1982 to 33.4% in 2012.

The percentage attending musicals has fallen from 17.1% to 15.2% between 2002 and 2012, during a decade when communities, especially in the South, went on an explosive spending spree predicated on that art form, while attendance at arts events in the South Atlantic fell lower than it did nationwide.

Even more worrisome, the number of annual visits per attendee by these musical theater-goers fell from 2.3 to 2 during that decade with attendance from various minority groups still a fraction of the overall population they represent.A Decade of Arts Engagement

Nearly 60% of attendance at musicals is now from those with household incomes of $100,000 or more, with 32.4% making $150,000 or more, predominantly older, white Americans.

This is hardly reassuring given the rapid transformation underway in demographics which is often disguised by increases in the overall population.  Nor is the percentage of Americans attending performing arts the only cultural activity in decline.

The percentage attending visual arts festivals or crafts fairs has declined from 33.4% to 22.4% over the decade between 2002 and 2012.

The percentage visiting historic sites or historic neighborhoods and architecture has fallen from 31.6% to 23.9% over that span while the percentage attending amateur or professional sports events fell from 35% to 30%.

Community destination marketing organizations (DMOs) will be able to find useful benchmarks in the analysis.

DMOs have the means to obtain the percentage of Americans who participate in individual activities.  If a DMO has subscribed to receive this data, it can be compared to general interest in an activity from studies such as this one as a means to understand potential.

On trips of 50 miles or more away, less than 10% of Americans will participate in particular activities of interest they enjoy while at home.

A handful of DMOs, such as the one for Durham, NC, where I live, gather marketing intelligence on day-trip visitors who travel less than 50 miles from home.

Studies such as this one provide an idea of the interest level for an activity in that radius, although again, the proportion interested in enjoying that activity while away, regardless of proximity, is a third of what it is at home.

But there are many other consumer behaviors to take into account.

Access to opportunity is one.  It is the long observed behavior that the more access a consumer has to an activity, the less likely or motivated they are to participate.

This means, for example, that the motivation to go to a musical or concert will lessen now that there are theaters offering those events in Charlotte, Durham, Greensboro and Raleigh.

Another is that participation can rapidly change over time as lifestyles change.

We’ve been aware for two decades now that the talent communities seek to attract is much less likely than earlier generations to frequent events in large-scale venues.

Rather than paying a large sum to sit looking forward without interacting for several hours is much less interesting to them than a street scene where they can come and go to a smorgasbord of various establishments such as restaurants, stores and nightclubs.

Even an analysis of motivations behind attendance at performing arts shows finds that more than three-quarters do it to socialize with family or friends.  Of those who didn’t attend, 44% cited lack of time and cost as the reasons.

Only 6.9% cited lack of interest in the program or event as a barrier to attending.

Musicals, in particular, should take note.  From my experience, the songs are far too long and the entire production is often twice the length it needs to be for the same impact.  I’m obviously not their target audience but neither is half the audience and it never hurts to recalibrate.

Communities spend tens of millions on cultural venues but usually have their minds made up by the time they do a feasibility study having already dismissed data available from their DMO, should it be data-driven.

But even if officials didn’t have those wires crossed or were better at fending off special interests focused on propping up property values to instead keep their minds open, few consultants are inclined or able to factor in some of the things noted above.

Almost never do these consultants analyze the effects of access to opportunity or even inventory a community’s comp set to index the number of venues to population.

Also missing, in the words of Indiana professor Joanna Woronkowski, an expert on cultural policy is an analysis of whether these proposed facilities risk “wasting scarce public resources and creating negative externalities” such as unwanted gentrification by destroying the day to day linkages that foster entrepreneurialism.

I’ve never found a feasibility report that looks at the risk new mainstream facilities can do to a community’s sense of place ecosystem or closely examine the mistakes of other communities who did something similar rather than only those they envy.

Of course, travel and leisure activities are not the only areas of activity undergoing fundamental change.

Durham largest and oldest Rotary Club is celebrating its 100th anniversary this year dating back to when the movement was born.  Through valiant effort, it is transforming its membership to be younger, more diverse.

But here and across the world, models such as this were focused not only to provide social interaction and feeding ground for extroverts but to harness critical mass to solve problems and improve communities.

Leaders there are well advised to read The Vanishing Neighborhood by researcher Marc Dunkelman.  In part, it is a review of books and studies dealing with a behavioral transformation among Americans since WWII which appears to be accelerating.

As the author notes, “mainframe” approaches such as this which have become as much about fundraising as about socializing or doing are giving way to generations now more comfortable with ad hoc groups that form around issues or projects and then dissolve.

DMOs have been forced for decades by stakeholders to keep scores of obsolete organizations on life support that at one time made sense but failed to grasp when their missions were accomplished or no longer relevant.

Communities and groups are well advised to be much more judicious when adding to cultural offerings by studying more closely the changes in consumer behaviors and the concept of obsolescence.

It will take them back to a deeper appreciation of what makes a community distinct and organically appealing and the values and traits that make a particular place worthy of love.

Tuesday, December 16, 2014

A More Inclusive Way To View Performance

Durham, North Carolina where I finished my career and still live in retirement just issued a report on how well the convention center here has been doing at erasing operating deficits.

There were some inconsistencies and misperceptions.

At both the city and county levels, Durham has always had excellent professional management during my twenty-five years here and none more so that under Tom Bonfield as city manager.

Governments at every level are not known for being able to fully account for and allot both revenues and costs to facilities. But neither are those in the free market economy.  More on that later including a new approach applicable to all sectors.

The convention center in Durham was always expected to run a deficit.

Back in the day when consultants weren’t punished for being candid with both pros and cons and most were not for sale, the consultant for the proposed Durham convention center projected a $450,000 annual deficit, which would be $1.8 million today.

But thanks to new management it now runs a $167,000 deficit and that is without fully attributing all related revenues.

For instance, if parking and ticket assessments are being used to make DPACs performance look even better, as they should, it seems the city should attribute revenues from the lease of “air rights” above it to the convention center’s bottom line.

The convention center here has always been hampered from harvesting more than its share of the out-of-town conventions and meetings drawn to Durham overall by having far too few hotel rooms in walking distance.

That is about to be more than remedied when by this summer the number of guest rooms at or within less than a block will increase nearly double to nearly 400 and another 259 within a few blocks.

A few are made feasible by revitalization but a good share are due to incessant communication, over nearly three decades now, by Durham’s marketing agency to point out downtown’s strategic location.

It is four miles from Research Triangle Park, adjacent to one Duke campus and two miles from Duke’s main campus and that of North Carolina Central University, as well as the most proximate to dining and entertainment districts.

But as the new management company has proven, the original management company back in 1989 could have closed the gap, had it not cursed the facility with a convoluted identity and a sense of entitlement.

When it opened, it not only made sense to contract management with the adjacent hotel owner but that contract was calibrated as an incentive by essentially covering all of the private hotel’s fixed costs.

But instead, the hotel company tried to brand the convention center merely as its private meeting space while still demanding preferential treatment, if not sole-sourcing to out-of-town groups selecting venues.

The city and county bear some responsibility for their own self-inflicted deficits by being passive until a few years ago with everyone except Durham’s marketing agency which it insisted must refer to the facility by it true identity while somehow dealing with the obfuscation it tolerated  elsewhere.

I cringed when news reports repeated (although in much more genteel language) an urban legend that somehow Durham’s community marketing agency felt “uncomfortable” with the arrangement inferring less had been done for the convention center back when I ran the DMO.

The cardinal rule for a DMO is to do what’s best for the community as a whole when it comes to optimizing visitation including the 10% who attend conventions, while maintaining a level playing field.

When it comes to attracting out-of-town meetings, this isn’t just about being fair to local stakeholders such as hotels and other privately-owned meeting space as well as the convention center but to be absolutely fair to meeting planners and organizers.

The job of a DMO is to draw attention to Durham and then assist while meeting planners and other site selectors make the best decision for their groups as to which venue and part of town are best for their needs.

It is up to each facility including the convention center by that point to close the deal and harvest their share while the DMO provides level platforms for information.

A few community DMOs play favorites, but it is at their peril as has been so often proven, including elsewhere in North Carolina.

However, a level playing field meant that the Durham DMO always did much more to promote downtown Durham, and thus the convention center, than it did for other facilities.

We made sure the other facilities understood why, but that this extra effort would stop short of ever “sole-sourcing” the convention center to a meeting planner which is what the management company and owner of the adjacent hotel demanded.

What did we do extra?  A special section on downtown including several pages of schematics on the convention center, dining maps to show proximity of restaurants, a walking tour, a time/distance/frequency shuttle schedule to and from other hotels and facilities to name just a few examples.

We even intervened to smooth over relations between the convention center management and planners from time to time back then when a sense of entitlement threatened to poison the site selection process.

But none of this overcame the primary reason the convention center performance was limited – the lack of nearby hotel rooms.

Of course there were market trends to blame.  The facility opened just as the nation’s meeting planners shifted preferences to hotel meeting facilities and away from downtowns and conventions centers because the number of facilities rapidly increased, while the number of conventions went into a long slow decline,

That is still underway today.

Until now, Durham’s local governments have avoided the slippery slope many communities have fallen down when they disguise deficits by creating special slush funds to pay out of town groups subsidies to use certain facilities.

Durham visitation outperforms those communities that do “pay for business” according to analyses of participation in activities such as conventions, sports and performing arts where that tactic is used.

Sadly, community marketing organizations and chambers of commerce are often the ones leading communities over this cliff.  But ultimately, the problem is not just a failure to understand the law of supply and demand.

If instead of subsidizing events, cities and counties as well as surrogates such as DMOs and chambers, where they contract other, traditional economic development services, would adopt full cost as well as full attribution accounting, they could make or recommend much better decisions.

This would be looking at the benefits as well as costs of events and facilities more holistically, like an ecosystem.

Maybe the convention center deserves partial credit for an event its existence helped intrigue even when another local facility in the community is selected.

Maybe the Museum of Life & Science deserves partial credit for increased property values in surrounding neighborhoods.  Maybe facilities and events that cannibalize underwriting, should deduct that from overall an event’s overall impact.

It isn’t as far-fetched or complicated as it sounds.

But cities and counties are not alone in the struggle to adapt accounting to be more consistent and inclusive when it comes to fully allotting costs and benefits.

The free market has long avoided “full cost accounting,” instead pushing what are called negative externalities (certain costs) off on consumers and taxpayers.

Even countries are now being challenged to move beyond merely using GDP (gross domestic product) or inputs minus subsidies in value as a measure of economic health.

An alternative to using only GDP is called IW (inclusive wealth) an approach that measures the positive change in human well-being across generations in a country by factoring in the social value of all capital assets, natural, human and produced.

It is consummately free market, just without opaque freeloading.

It has been under refinement since at least 1987 and linked here is the 2014 Inclusive Wealth Report. It doesn’t reject the value of GDP.  It just takes a much more full-accounting approach to growth, and particularly sustainable growth.

Natural capital includes fossil fuels, minerals, forests including non-timber resources and agricultural land.  Human capital involved education and health.  Produced capital includes equipment, machinery, roads etc.

Add them up and deduct things like oil capital gains and carbon damages and you have an Inclusive Wealth Index.  My interest is in natural capital so I’ve read and re-read the 2012 report with a focus on that area.

Each report gives a rating overall for 140 countries and then zeros in on one of the three areas of capital, sort of like a balance sheet is used by the private sector but far more inclusively.

Accounting and metrics such as these are important because they help individuals, communities, states and countries make decisions with a full understanding of the inherent tradeoffs.

To bring it back to subsidizing events, even when the dollars are raised privately, they didn’t just magically appear without having an adverse impact on areas including other events.

Failing to grasp subtleties such as this is how communities make decisions that gradually hollow out unique sense of place.

Inclusive Wealth is a better way of looking at deficits and surpluses as well as a far more inclusive way of measuring impact.

The sooner it filters down to the local level, the better it will be for communities still able to salvage the distinct sense of place that make them worthy of love by both those who live there but those who visit regardless of purpose.

Wednesday, November 05, 2014

The Underlying Fallacy of More and More, Bigger and Bigger

It should have been no surprise to, at least, tourism marketers when airlines serving Brazil attributed a drop in revenues due to the World Cup.

The paradox of mega-sports events is that they displace more economic impact than they create.  A classic illustration of that is when an economist measured tax revenue collected in a community that hosted the Super Bowl.

It varied little from collections over that same period the year before and the year after.  How can this be when input-output measures taken computed value-added?

The answer is displacement and it’s why sustainable community marketing is not about more and more or bigger and bigger but how to feather sports groups or conventions or festivals in a way that doesn’t create displacement or increased public services or inconvenience.

It is also the little known secret to why communities that carefully do this, outperform or perform equal in the proportion of visitors they draw for those segments compared to those that go “big game hunting.”

Economic impact models struggle to measure the economic activity that huge events override or dislocate such as the economic activities people would have been doing anyway or those they didn’t or couldn’t or chose not to do because of the event.

It is possible, but they would be costly to run.

If fact, if these analyses went beyond just the local or even metro or state levels, the events may turn out to have a negative impact when taking into account their impact on a national, continental or even hemispheric level.

Sure, there is value added from people who bought snacks and beverages to throw home parties for friends to watch on television or from people who went to sports bars or drank more or stayed longer who wouldn’t have otherwise or who traveled to see the event in person.

But that amount would need to also net out the activity these consumers would have generated anyway had then been out shopping or buying vehicles or attending performances or taking trips they postponed to avoid perceived crowds or to watch the event on television instead.

Ironically, the net effect of mega-events can be negative overall.

Does that mean mega-events are bad?  Nope.  Just that communities and nations shouldn’t be deluded by those who use economic impact as a rationale for hosting the events.

It is also why visitor-centric economic development organizations such as those I ran over a four decade career can, if data and results-driven, be frustrating to stakeholders who don’t understand their purpose or who make up their minds and then take interest only in information to support their opinions.

Such organizations, called community, state or national destination marketing organizations are often given only one of two choices by powerbrokers.

Just go along to get along while withholding critical information from the public or get steamrolled and disparaged including as one official threatened me once misusing a metaphor, being forced to “fall on your own petard.”

People aren’t rational by nature, especially fanatics, but the role of a community destination marketing organization, while it involves bringing popularity to a particular place, isn’t to be popular but instead, rational.

Many years ago, I had a chair of my governing board who worried about my personal welfare, dismissed the high regard for our organization and me personally in scientific residents polls or anonymous opinion polls of community stakeholders.

His was overly concerned with the opinions of a trio of people who wanted my head and seemingly hated the community marketing organization  I led and therefore lobbied whoever would listen to undermine us.

So I spent an inordinate amount of time and energy meeting with these individuals in an attempt to better understand where they were coming from, even hiring a consultant who was an insider in their circle to coach me.

They were nice enough in person but what got under their skin was simple.  We made decisions based on data, not who’s asking.  When the data didn’t make our case we were as likely to distribute to inform community decisions as we were when it did.

My job though, was to continue to try in every way possible to show even detractors how they could also achieve their objective using data and sustainable tourism.

I was lucky to have governing boards who stood behind me as long as we were following the data, resisting special interests and doing what was best for the community overall.

It is also why I have empathy for former peers who weren’t so fortunate and who, instead, were forced to surrender their community’s welfare to powerful forces, a slippery slope from where there can be no return.  “But for the grace of God, go I.”

In one community, a cabal of five people collectively came after me, ostensibly over my “style” which has definitely always been a work in progress.  I survived there on a 10-7 vote, a veritable landslide in political terms.

In my two other communities, similar votes under even heavier-handed circumstances, though less publicized, were far more favorable, a testament more to my heart than style.

But that’s all part of the job.  Politics is personal, not logical, but in community marketing you can never make it the former.

The job of community destination marketing is to reap a community’s full share of visitor-centric economic and cultural development.  That requires four things not generally understood as part of marketing:

  • Strategically deciding what not to do;
  • Disqualifying events, groups and segments of potential visitors that don’t fit or cost more than they can deliver;
  • Pursuing visitation in scale that will complement and appreciate things distinct to a particular place; and
  • Seeking to do no harm to the things that make a community worthy of love.

In summary, without surrendering to more and more, bigger and bigger, the organizations I led were able to statistically outperform or keep pace with those that did, even if it didn’t make the news or appease special interests.

Tuesday, September 16, 2014

Looking Back To A Revealing Era of Common Sense

As if on cue each year, news reports in Durham, North Carolina will headline that the convention center here ran a deficit as if there shouldn’t be one or that this wasn’t expected when it was built.

A new book I recently finished inspired me to read back through each of three feasibility studies that were conducted between 1972 to 1982 for facilities of this type on behalf of each of the three different mid-sized cities in different parts of the country.

This was the first of my now concluded four decades in visitor-centered economic and cultural development during which I would represent these three cities.

It is a span when studies such as these seemed far better grounded and realistic than many before or since.

Last reported, the annual deficit for the civic/convention center in Durham, where I still live in retirement, was $104,000.  That is without netting out tax revenues generated from related visitor activity or even parking revenues.

If they had, it would cover that amount by more than double.

Leading up to construction of the facility, consultants warned the City based on a 1977 survey of convention centers in other cities in North Carolina, to expect a deficit of around $450,000 annually or about $1.8 million in today’s dollars.

The fact is, cultural infrastructure doesn’t “pay” for itself any more than roads or other types of infrastructure.  The only difference is that communities very rarely build roads that aren’t needed.

But in-depth research going back nearly a century reveals that local officials across the country have long been pushed by business interests to build stadiums, convention centers, and increasing over the last decade, performing arts centers.

Ostensibly this is for tourism-related purposes but the real motives have been to shore up the values of surrounding private property in downtowns.

From their own public records including private papers, it is clear this has most often been done, to paraphrase their words, as a means of “shoring up” downtown property values or “insulating” them from “erosion” in nearby neighborhoods.

Other ulterior motives were to act as “anchors” to facilitate private loans or as “people generators.”

If a cultural facility is ever reported to be breaking even, it is usually a sign that ancillary revenues are being included while costs related to capital and site preparation are conveniently not.Durham Convention Center

Feasibility consultants up through the 1970s, called convention centers by the name “civic” centers because they knew that “75% of the days in a year that the civic center is in use is for local meetings, dances, banquets, [expositions] etc.”

Even today scientific surveys of residents show that more experience a civic/convention center in a given year than any other cultural facility.

Eventually renaming them convention centers, this was said to appease a handful of meeting planners seeking ego gratification, but the real reason, along with pressure to increasingly overstate performance, was to rationalize using visitor taxes as a means to avoid public referendums.

Durham dodged a bullet when it waited ten years after that 1977 feasibility study to secure voter approval to build a civic/convention center, but still at the modest size that had been originally recommended.

Consultants could see back then that far more cost/benefit accrued to centers just 9% of the size of today’s behemoths and less than half the size of centers back then.

Even then, before it ever opened, the Durham Civic Center was situated so as to fulfill its role related to surrounding private property values.

Many other cities over the next two decades, would go on a “big game hunting” binge, doubling the amount of similar space across the nation, while convention and meeting tourism began a long, gradual decline.  The proportion using these facilities plummeted to just 8%, at tops 15%.

The same thing is happening now with performing arts centers with hundreds of new facilities opening in just the last decade while Americans attending concerts as a percentage of the U.S. population has remained flat at around 22% and even down in areas such as touring Broadway.

But based on the findings of urban policy-making researchers, nearly all of these cultural facilities fulfilled their primary “real estate” purpose before they ever opened, pimping tourism merely as a means to access funding without voter scrutiny.

Though undetected yet due to systemic changes in the convention/meeting/facilities landscape, we know know that convention/civic centers were destined to become unviable by the 1980s.

But based on performance surveys of convention centers in the mid-1970s, it was estimated that, on average, these facilities should expect to harvest up to 45% of the overall convention and meeting attendance in their communities.

The overall nationwide decline in convention and meeting demand was imperceptible and unfathomable in the 1970s,  But it would soon begin to show graphs as each dip in demand began to fall slightly lower than the last and each subsequent rise peaked short of the one prior.

It has continued with few exceptions over the past four decades, still undetected by those zooming in on too tight a focus.

Unaware, consultants in the mid-1970s, as they did for Durham, would often predict that a community’s “delegate count would not increase significantly without facilities provided by a civic center.”

This mantra would prove wrong as would a pervasive amnesia about the primary use of these facilities being local.

But what also wasn’t anticipated was the sudden explosion across the country in the number of major convention hotels across the nation (with at least 150 guest rooms and at least 5,000 square feet of meeting space.)

An even bigger surprise was how much more popular they would become nationally than civic/convention centers.

It was inconceivable to consultants in the late 1970s and early 1980s that the proportion of conventions interested in convention/civic centers as a venue would soon plummet rather than skyrocket as predicted.

It is the miscalculation that haunts many cities today where sense of place has been exchanged for things bright and shiny only to find their overall appeal diminished.

Using Durham as an example, forecasts in 1977 for Durham estimated only a slight increase in the number of guest rooms over the next few years and a leveling off during the remainder of the 1980s.

Instead, by the time Durham’s convention center and an adjacent private hotel opened, there were already 10 or more convention hotels across the community vying to harvest conventions and meetings drawn here.

By the time its center opened, Durham was already drawing a third more convention attendees overall than had been projected by the consultant.

With a community destination marketing organization then in place, within three years Durham, community-wide, was drawing more than three times that amount and would soon eclipse its fair market share of that segment of visitors.

But in part because under contract it was held hostage to the priorities of the adjacent hotel, which naturally limited its availability when more lucrative visitors were available, the convention center was harvesting only 8% of Durham’s convention attendees instead of the 46% projected.

Still, as the consultant had forecast in 1977, even the existence of a very modest civic/convention center can often serve a role in a community’s marketing appeal to meeting planners even though the events are ultimately held elsewhere in Durham.

Of course, this is a very expensive way to amplify marketing, but should be credited when considering operating deficits.

One elected official obsessing a decade ago about the center’s operating deficit quipped in a moment of frustration to a group looking at data showing the local tax revenue generated by visitors who attend conventions and meetings:

“Why do we care about meetings held in other parts of town, we need to close that facility’s deficit!”

A more strategic member of the group quickly reminded the group:

That this would be “fiscally cutting off one’s nose to spite one’s face.”

Another added to the chorus of nods around the room, “more like Hara-kiri.”

This would have robbed the city coffers of millions of dollars in revenue from conventions and meetings and undermined scores of businesses just for the sake of avoiding uninformed criticism.

It varies, but the convention/civic center in Durham generally harvests about 25% of Durham’s overall convention attendance.  While not the 45% projected in 1977, this is two to three times the proportion held in convention centers nationwide.

By the time I retired five years ago, the percentage of meetings using convention centers nationwide had dropped to between 8% and 15%, depending on the report, with nearly 90% of conventions and meetings now using convention hotels or other types of lodging with meeting facilities.

During the course of my career, the proportion using convention/civic centers fell by more than 80%, by nearly a quarter in the last few years alone while the communities I represented continued to grow and exceed market share for that visitor segment.

So it isn’t likely Durham’s facility can somehow buck that trend.

Another systemic change that has occurred since the late 1970s is the proportion of day-trip to overnight attendees going to conventions and meetings.

Even today, consultants will often project that as many as 75% of attendance at conventions and meetings held in convention/civic centers will be overnight.

But even when daytrip attendees who travel less than 50 miles are excluded (and they shouldn’t be), 41% of attendees are now “local.”   Fully a third of the attendance now at major national conventions comes from within each state where the meeting is held.

Overnight delegates aren’t quite half of attendees.

But as I retired in 2009, even in major convention destinations such as New York City, only 39% of the attendees at conventions and trade shows (not exhibitions) held in its 1.8 million square foot convention center were overnight visitors and more than a fifth were local residents.

Overnight delegates attending events in the 700,000 square foot convention center in Washington D.C. represented just 4% of the community’s total.

Even as long ago as 1993, as the newly opened civic center in Durham was finding its legs, consultants for the Georgia World Congress Center in Atlanta, using historical data there, found only 45% of attendees to conventions were overnight visitors.

Still, other cities, including nearby Raleigh and Charlotte, tore down those facilities the Durham consultant found to be too large to be optimal in 1977 and erected new ones five times larger, the former out of envy for the latter according to an editorial there.

As I retired five years ago, the performance of Charlotte’s much larger center was barely measuring up to that much smaller predecessor, harvesting about what the other one did in 1991.

Cities that open huge convention centers such as these also find, if they are looking that is, that as a percentage of overall visitation they are drawing the same as cities with much more modest facilities such as Durham.

Even though it has a 3.2 million square foot (soon to be 3.7) convention center, Las Vegas draws the same proportion of its visitation to attend conventions that Durham does.

Its proportion of visitors attending conventions has been relatively unchanged through three expansions, even though 50-60% of delegates say they were more likely to attend because the convention was held there.

On top of the glacial decline in convention business nationwide, the migration of more and more to hotels and trends to lower proportions of overnight attendees, the massive oversupply of convention center space has caused these cities to shell out subsidies to secure business, adding to its deficits.

But conventions and meetings nationwide now have fallen below 9% of overall visitor person stays while the annual number of visitors being drawn to destinations such as Durham has been increased four-fold since the convention/civic center opened.

Shackled to mega-facilities, other cities are siphoning away marketing dollars that would bring a far greater return if redeployed to other visitor segments.

Durham will soon have 578 lodging guest rooms within walking`` distance of its micro-sized convention/civic center and another 145 nearby, nearly what it had back when the facility was first studied in 1977, but still fewer than what consultants had suggested would be spurred when the facility was built.

But Durham officials should question very seriously any future calls for a new or expanded center.  As it did in the 1980s, Durham should buck any effort to do so for ulterior motives such as propping up, insulating or anchoring real estate values.

The facility is doing just fine and outperforming the national average for proportion of convention attendance harvested by a convention center by nearly double.

Judging by market data and the lack of performance by larger facilities in other cities, it is highly unlikely that with more space it would be able to do any better than it is now and there are much less expensive ways to improve visitation.

Instead, officials are better advised to put the effort into better educating news outlets and the general public.

The ultimate return from cultural facilities, like that of other public infrastructure, is found strategically in a vibrant community not some narrow and arbitrary bottom line.

Wednesday, June 25, 2014

Distinguishing Complainers From Whiners

Dove-tailing on yesterday’s essay, I have always found it puzzling how many people who are unfriendly to data and analytics or resistant, at best, are found working in organizations whose very mission is formed around analytics as a core asset.

This includes organizations at the forefront of today’s economy such as healthcare, pharmaceutical, biotech and educational concerns.

One of the board members who recruited me to Durham, North Carolina credited me recently in a retrospective for teaching board members about destination marketing in general and specifically, the value of using data to forecast direction.

That may be, but only the governing board as a unit as it evolves through time can make sustainable the embedding of analytics and strategic mindset as core values in the culture of an organization.

If other members aren’t continually vigilant, however, this culture can be so easily undermined by pressure from special interests for whom being strategic is an obstacle to self-serving agendas.

It can be as simple as forgetting to measure performance of analytics which is now considered equal in importance for executives to creativity, falling right after strategic mindset.

Even boards who persevere over many years are vulnerable to regression during periodic CEO successions, a time when charisma often overwhelms substance.

Crucial is selecting someone who grasps both the organization’s story, and in the case of destination marketing organizations, (DMOs) that of the community it serves.

This is best detected by how well they grasp the analytics central to the collective culture and narrative of both.

We shouldn’t make the mistake of always lumping together data and analytic tools such as metrics.  Those same authors I mentioned yesterday distinguished them in an earlier article this year in Harvard Business Review.

Data is data, but it isn’t something over which we have control.  Analytic expertise, particularly at the executive level, is the ability to convert data into metrics that can be consistently tracked and utilized over many years.

Then it can be woven into a strategic narrative.

An organization such as a DMO should be able to track several hundred metrics which are then collapsed into a dozen or so that not only represent what a DMO and its community care about, but more importantly, what they should care about.

This requires measuring against comparable sets of community destinations not for purposes of emulation but to identify outcomes that can truly differentiate a destination while still achieving market share.

In other words, metrics aren’t always about exceeding the norm, some metrics are maintained to measure a community’s divergence away from the norm.

In the words of Dr. Michael Porter, strategy is “about deliberately choosing to be different.”

At the deepest root of why DMO’s exist is the notion of protecting and fostering sense of place, that unique character that makes them worthy of affection.

Visitation, demand-based economic development, and tax revenue generation, are all merely a means to that end.

If residents of a community predominantly value sense of place, they will see its DMO as relevant.  If it is relevant to people who truly love the community, then the DMO will be relevant to local officials.

But it is also a DMO’s responsibility to sound warnings about things that erode sense of place.  Using data-analytics-metrics to strategically evaluate and choose among trade offs greatly improves the odds of doing that.

This is also why being a DMO exec is so precarious.  This part of the job will cause the DMO to occasionally step on the toes of some very powerful special interests, and it should.

Left unchecked, appeasing powerful but mainstream interests sets in motion forces that rapidly hollow out the very essence of place and “what makes our physical surroundings worth caring about or visiting.”

Fostering a community’s unique character is more than just protecting its past.  In the words of development expert Ed McMahon, it means helping communities adapt to change while maintaining and valuing the things that make it distinct.

There were occasions in all three communities in which I served when special interests attempted to blackmail governing boards.  They were rescued by sound analytics-driven decisions along with copious amounts of moral courage.

The management and boards of effective DMOs will be labeled complainers from time to time, ironically by those who themselves are whiners.

But pity the poor DMOs without data and analytics to back up their concerns or inability to discern the difference in those descriptions.

Many who serve on boards, including elected boards, fail to distinguish complaining from whining.

A complainant is one who has the best interests of others and the community at heart.

Whiners are those who seek special treatment or simply resent paying their share.

Oh, there is one more difference.  Whiners are often cheap, mean and vindictive.  Complainers are just frustrated and puzzled but willing to shoulder their full share and more of any cost.

Both deserve to be heard and provided more information but the former deserves more attentiveness, especially if the concerns are data-driven and contrary to prevailing opinion.

Training on how to triage complaints, including pressure from whining special or self-interests, should be de rigueur for all who serve on governing boards, especially elected officials.

Saturday, February 11, 2012

Infographic – Economic Impact Of Visitors To Durham

Cick on image below or this link for full infographic!

durham visitor impact