Showing posts with label Economic Value. Show all posts

Wednesday, March 04, 2015

When We Were Only 4,646

In mid-1989 I flew across the country to take on destination marketing for Durham, North Carolina.  As a lifelong 6th generation westerner I was unaware that my roots as a Tar Heel go back more than 200 years before I was born.

When one of my 6th great grandfathers, David Miller, was born in what would later become Orange County, barely more than a tenth of North Carolina’s 100 counties had been formed.

At the time the future state’s population had grown to about 30,000 people, about the size today of the town of Sanford or Cornelius, a village along the shores of Lake Norman.

North Carolina at the time stretched beyond the Appalachians clear to the Mississippi River.

But apparently, it soon became too crowded for my earliest roots here.  My 5th great grandparents, who had also been born in what by then was Orange County, may have been the first to move west, settling Pickens County, Alabama with Revolutionary War veterans along the Tombigbee River.

By 1847, the progeny of those Tar Heel roots were headed up and over the Rockies, more than a thousand miles beyond the frontier.

I find it fascinating not only to dig back into family history but to put the lives of my ancestors in context.

My American roots go back to 1630 long before any permanent settlement of North Carolina had occurred and when there were only 4,646 settlers in all of what would become the United States.

These 10th great grandparents William and Goditha Learned settled in Charlestown and were quickly followed within a decade by several others.  Many ancestral lines had arrived at a time when the future U.S. population was around 300,000, a little more than Durham County today, where I live.

Within a few years, most began small migrations west until by the late 1820s, when many such as the Sheltons and Neeleys migrated to points along the western frontier just as my North Carolina roots had.

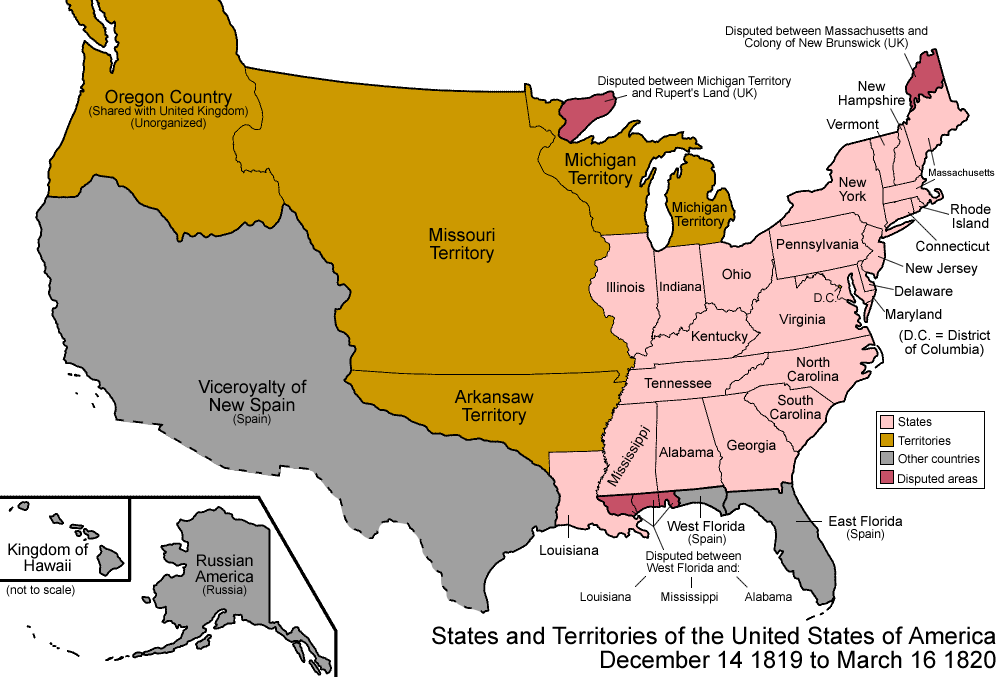
Back then the map of America looked as it does in the map shown in this essay.

When three of my ancestors became some of the first settlers to ride down into Salt Lake Valley in 1847 there were fewer than 90,000 non-Indians living in what would become the contiguous Western states (an area nearly twice the size of Western Europe.)

This was less than the population of Arkansas at the time and about 78% of westerners lived in what are now New Mexico and Arizona.  What are now Montana, Idaho, Utah and Nevada were completely unsettled when my ancestors crossed the Rockies.

Stretching behind them for 1,100 miles was territory yet to be organized in any way except for a few isolated military forts.

All of my ancestors but two lines had crossed over the Rockies by 1850 when a compromise in Congress over slavery created the map at this link.

The remaining two joined them by 1857 and 1862 directly from England and Scotland, respectively.

By then, one of my great-great grandfathers, Charles Harper, who was on the vanguard wagon train west, had returned several times to guide others across, making at least four round trips over the 1,100 mile route.

Each of these ancestral lines went on to create many other settlements, all within a few miles of the 111th Meridian West, including at the most northern end, my native land where ultimately all of these DNAs converged.

I have no way to know if I am the first person created by the convergence of all those ancestral lines to fully reverse the migration 142 years later, living in North Carolina now for nearly 26 years.

Many were crafts men and women before crossing the Rockies to become frontiersmen including carriage makers, tailors, seamstresses and business owners, but once over the Rockies they all became experts at economic development, which became my career.

They mined sufficient gold to create currency, learned to “buy local” even if the goods were inferior because to buy from back east not only robbed local economies of their full value added, but local because it gave local manufacturers the opportunity and resources to improve.

None were wealthy and some could not afford the trip west without needs-based loans from the Perpetual Immigrating Fund (PEF) which they inaugurated in October 1849, just over 24 months after the first arrivals west of the Rockies.

It was capitalized by wealth transfers from donors and tithes paid to the Mormon Church and repaid once recipients made their way west from as far as Europe and other countries before being re-loaned.

Precedent was given to those with needed skills as well as the relatives of donors who paid into the PEF.  In all, more than 30,000 people used the fund to get a hand up over the nearly 40 years it was in existence before it was outlawed by reactionaries in the U.S. Congress.

Repayments were forgiven if they were keeping people in poverty.

Fourteen years ago this Spring, the Mormon Church resurrected the idea but as the Perpetual Education Fund to help members in need who are under 30 years of age and committed to repayment to get training and education that leads to employment or self-employment.

Unfortunately, today many Mormons who pride themselves on not speaking ill about others are, by insinuation nonetheless insensitive to the poor unless they happen to be Mormon. This is especially true of those who have fled diverse cities for exurbs.

Gallup surveys find that a greater proportion of Mormons are conservative than any other U.S. religion, 59% compared to 31% moderate and 8% liberal.

Largely due to the migration from more diverse areas to exurbs, this is also true in places along the 111th Meridian where Mormons fled for religious freedom.

It is even more true of those who are active in the church, with 65% conservative, 29% moderate and 5% liberal.

But the views of those in white flight may have cost more than diversity of thought and discourse.

The 6-in-10 (here and abroad) such as me whose participation has lapsed are half as conservative as those who are active, far more moderate and four times more liberal than active Mormons although many remain positive about the culture in general.

A tiny percentage now trace back to the migration over the Rockies in search of new homelands but unfortunately, it is clear that some of the values and lessons from that period may becoming equally rare.

The white flight of today is different than that which occurred in the late 1950s and 1960s.  Across the country, it seems to have more to do with what some term as racial politics than with poverty or transfers to provide a hand up.

But that is for another essay.

Wednesday, January 21, 2015

Prosperity Linked to Proximity to Protected Lands

News headlines about my native Intermountain West always seem limited to a few angry white extremists with guns or elected officials pandering to campaign contributors eager to exploit its natural resources.

Rarely, by the time news gets back to Durham, North Carolina where I live, does it provide more nuanced coverage of this complicated region including news of studies that run counter to those narratives.

Studies I’ve been reading, including one that analyzes the 284 non-metro counties in the west as a whole where there are substantial amounts of protected federal lands, are fascinating.

One study zeroed in on those with lands protected for conservation and analyzes non-metro, county-level economic performance in these places from the present to, in some cases, back as far as the 1970s.  Others analyze the performance of a all 413 counties in the 11 contiguous western states.

The current wave of anti-regulation rhetoric dates not to the 1960s regulations to protect water, air and the food supply or when the EPA was created as many assume or the anti-government rhetoric used by the Reagan administration but not shared by the American public in the 1980s.

The anti-regulation chant of today has its roots in 1947, when partisan post-WWII Republicans resumed the drumbeat of how regulations are a burden regulations are on business, while dismissing that without them an even greater burden is shouldered by individual Americans.

I was born and spent my early years during this period in a million acre- Idaho county wedged into that nook between Montana and Wyoming.  Only 31% of the land area was in private hands such as our ancestral ranch just west of the Henry’s Fork.

More than 58% of Fremont County is under federal protection on behalf of all Americans including a portion of Yellowstone National Park and the Targhee National Forest.

To put this in perspective, the amount of federal lands in my native Fremont County, Idaho is 3.6 times the land area of Durham County, North Carolina where I live but with only 3% of the population.

Only 67,642 acres of the more than of Fremont County is protected for conservation purposes and relevant to the study of all 284 non-metro counties in the west with such lands.

The studies were done by the independent, non-profit, non-partisan Headwaters Economics based in Bozeman, Montana, up and over the Continental Divide and 150 miles north of our ranch where my parents eloped as my dad headed off to WWII.

The study was conducted to determine if these projected lands were associated with decreased or increased economic performance.  The numbers show that performance is higher for every 10,000 acres of protected federal land a county has.

It turns out that the economic performance in non-metro western counties with protected federal lands is as much as 345% on average compared in some areas compared to 83% for non-metro lands in the west with no protected federal land.

Between my junior and senior years of high school, I read A Wilderness Bill of Rights by Supreme Court Justice William O. Douglas, who grew up along the eastern slopes of the Cascade Mountains in Washington State.

Appointed when he was just 40 years of age, his time on the highest court spanned from when my dad was in high school until my law school days.

His words transformed my spiritual and restorative feelings about nature into an entitlement for all Americans, as important as freedoms of speech and religion.

It had a profound impact.

Five years after Douglas retired from the high court, as President Ronald Reagan was elected, the news media, made the mistaken assumption that his popularity meant that his anti-government rhetoric must be widely shared, amplifying partisan news releases.

But both the news media and publicists were mistaken.  Polls following the election showed that only 21% of Americans shared that notion, about the same percentage as in 1976, possibly contributing to approval ratings for Reagan that several years later dipped into the 30% range.

It is the same today.  Americans don’t share anti-regulation rhetoric when the consequences become clear even though the term regulation has been sequestered and demonized my entire lifetime .

Campaign strategists then and now were brilliant, seeking not to sway public opinion but to make certain words radioactive such as environmentalist, federal government and taxes, creating a political correctness that distorted the self-perception of Americans.

It still gridlocks us today.

I much prefer to look at analysis of the actual numbers, not because they will change anyone’s mind but because they provide relief.

Oh, and by the way, studies show that non-rural counties in the west that are exploited for natural resources, actually in the long term suffer economically.

Just sayin’.  Too bad facts don’t have lobbyists.

Tuesday, December 16, 2014

A More Inclusive Way To View Performance

Durham, North Carolina where I finished my career and still live in retirement just issued a report on how well the convention center here has been doing at erasing operating deficits.

There were some inconsistencies and misperceptions.

At both the city and county levels, Durham has always had excellent professional management during my twenty-five years here and none more so that under Tom Bonfield as city manager.

Governments at every level are not known for being able to fully account for and allot both revenues and costs to facilities. But neither are those in the free market economy.  More on that later including a new approach applicable to all sectors.

The convention center in Durham was always expected to run a deficit.

Back in the day when consultants weren’t punished for being candid with both pros and cons and most were not for sale, the consultant for the proposed Durham convention center projected a $450,000 annual deficit, which would be $1.8 million today.

But thanks to new management it now runs a $167,000 deficit and that is without fully attributing all related revenues.

For instance, if parking and ticket assessments are being used to make DPACs performance look even better, as they should, it seems the city should attribute revenues from the lease of “air rights” above it to the convention center’s bottom line.

The convention center here has always been hampered from harvesting more than its share of the out-of-town conventions and meetings drawn to Durham overall by having far too few hotel rooms in walking distance.

That is about to be more than remedied when by this summer the number of guest rooms at or within less than a block will increase nearly double to nearly 400 and another 259 within a few blocks.

A few are made feasible by revitalization but a good share are due to incessant communication, over nearly three decades now, by Durham’s marketing agency to point out downtown’s strategic location.

It is four miles from Research Triangle Park, adjacent to one Duke campus and two miles from Duke’s main campus and that of North Carolina Central University, as well as the most proximate to dining and entertainment districts.

But as the new management company has proven, the original management company back in 1989 could have closed the gap, had it not cursed the facility with a convoluted identity and a sense of entitlement.

When it opened, it not only made sense to contract management with the adjacent hotel owner but that contract was calibrated as an incentive by essentially covering all of the private hotel’s fixed costs.

But instead, the hotel company tried to brand the convention center merely as its private meeting space while still demanding preferential treatment, if not sole-sourcing to out-of-town groups selecting venues.

The city and county bear some responsibility for their own self-inflicted deficits by being passive until a few years ago with everyone except Durham’s marketing agency which it insisted must refer to the facility by it true identity while somehow dealing with the obfuscation it tolerated  elsewhere.

I cringed when news reports repeated (although in much more genteel language) an urban legend that somehow Durham’s community marketing agency felt “uncomfortable” with the arrangement inferring less had been done for the convention center back when I ran the DMO.

The cardinal rule for a DMO is to do what’s best for the community as a whole when it comes to optimizing visitation including the 10% who attend conventions, while maintaining a level playing field.

When it comes to attracting out-of-town meetings, this isn’t just about being fair to local stakeholders such as hotels and other privately-owned meeting space as well as the convention center but to be absolutely fair to meeting planners and organizers.

The job of a DMO is to draw attention to Durham and then assist while meeting planners and other site selectors make the best decision for their groups as to which venue and part of town are best for their needs.

It is up to each facility including the convention center by that point to close the deal and harvest their share while the DMO provides level platforms for information.

A few community DMOs play favorites, but it is at their peril as has been so often proven, including elsewhere in North Carolina.

However, a level playing field meant that the Durham DMO always did much more to promote downtown Durham, and thus the convention center, than it did for other facilities.

We made sure the other facilities understood why, but that this extra effort would stop short of ever “sole-sourcing” the convention center to a meeting planner which is what the management company and owner of the adjacent hotel demanded.

What did we do extra?  A special section on downtown including several pages of schematics on the convention center, dining maps to show proximity of restaurants, a walking tour, a time/distance/frequency shuttle schedule to and from other hotels and facilities to name just a few examples.

We even intervened to smooth over relations between the convention center management and planners from time to time back then when a sense of entitlement threatened to poison the site selection process.

But none of this overcame the primary reason the convention center performance was limited – the lack of nearby hotel rooms.

Of course there were market trends to blame.  The facility opened just as the nation’s meeting planners shifted preferences to hotel meeting facilities and away from downtowns and conventions centers because the number of facilities rapidly increased, while the number of conventions went into a long slow decline,

That is still underway today.

Until now, Durham’s local governments have avoided the slippery slope many communities have fallen down when they disguise deficits by creating special slush funds to pay out of town groups subsidies to use certain facilities.

Durham visitation outperforms those communities that do “pay for business” according to analyses of participation in activities such as conventions, sports and performing arts where that tactic is used.

Sadly, community marketing organizations and chambers of commerce are often the ones leading communities over this cliff.  But ultimately, the problem is not just a failure to understand the law of supply and demand.

If instead of subsidizing events, cities and counties as well as surrogates such as DMOs and chambers, where they contract other, traditional economic development services, would adopt full cost as well as full attribution accounting, they could make or recommend much better decisions.

This would be looking at the benefits as well as costs of events and facilities more holistically, like an ecosystem.

Maybe the convention center deserves partial credit for an event its existence helped intrigue even when another local facility in the community is selected.

Maybe the Museum of Life & Science deserves partial credit for increased property values in surrounding neighborhoods.  Maybe facilities and events that cannibalize underwriting, should deduct that from overall an event’s overall impact.

It isn’t as far-fetched or complicated as it sounds.

But cities and counties are not alone in the struggle to adapt accounting to be more consistent and inclusive when it comes to fully allotting costs and benefits.

The free market has long avoided “full cost accounting,” instead pushing what are called negative externalities (certain costs) off on consumers and taxpayers.

Even countries are now being challenged to move beyond merely using GDP (gross domestic product) or inputs minus subsidies in value as a measure of economic health.

An alternative to using only GDP is called IW (inclusive wealth) an approach that measures the positive change in human well-being across generations in a country by factoring in the social value of all capital assets, natural, human and produced.

It is consummately free market, just without opaque freeloading.

It has been under refinement since at least 1987 and linked here is the 2014 Inclusive Wealth Report. It doesn’t reject the value of GDP.  It just takes a much more full-accounting approach to growth, and particularly sustainable growth.

Natural capital includes fossil fuels, minerals, forests including non-timber resources and agricultural land.  Human capital involved education and health.  Produced capital includes equipment, machinery, roads etc.

Add them up and deduct things like oil capital gains and carbon damages and you have an Inclusive Wealth Index.  My interest is in natural capital so I’ve read and re-read the 2012 report with a focus on that area.

Each report gives a rating overall for 140 countries and then zeros in on one of the three areas of capital, sort of like a balance sheet is used by the private sector but far more inclusively.

Accounting and metrics such as these are important because they help individuals, communities, states and countries make decisions with a full understanding of the inherent tradeoffs.

To bring it back to subsidizing events, even when the dollars are raised privately, they didn’t just magically appear without having an adverse impact on areas including other events.

Failing to grasp subtleties such as this is how communities make decisions that gradually hollow out unique sense of place.

Inclusive Wealth is a better way of looking at deficits and surpluses as well as a far more inclusive way of measuring impact.

The sooner it filters down to the local level, the better it will be for communities still able to salvage the distinct sense of place that make them worthy of love by both those who live there but those who visit regardless of purpose.

Thursday, September 25, 2014

Edifice Envy - Questions Not Asked

A friend who was standing in a long line caught my attention recently as I exited the restroom during opening night intermission of the London musical, Dirty Dancing.

We exchanged mixed feelings about the increasing use of video in such productions and reminisced that the movie upon which the musical is based featured North Carolina as a stand-in for the Catskills.

Then, noting that some cities seem eager to replicate the Durham Performing Arts Center where I live, he asked rhetorically as we parted what I thought they might be missing.

It gave me food for thought as I returned to my seat.  In my experience of meeting over the years with scores of cities on such field trips, it isn’t what they ask but what they aren’t asking that often makes the difference.

DPAC is one of hundreds of large-scale venues that have opened in just the last decade.  Even before it opened, consortiums of consultants, funders and managers began wringing their hands about the consequences.

Many researchers have begun digging into this but it will take a decade or two for any correlations of the impact on local cultural ecosystems to be established.

Cities looking with envy to replicate performing arts, sports or convention centers usually take these field trips to reassure reluctant stakeholders.  Durham initiators took one to Greenville, South Carolina for example.

But rarely are the right questions asked that will drill down into what may be anomalies.

Durham’s new theater has been a huge success so far but the reasons often go unexamined during these field trips, especially factors that are serendipity.  For example:

1) Durham’s success is not because it lured Nederlander and the company’s equally exceptional non-profit partner PFM as operators, but because Nederlander came knocking.

The company, one of the largest owners and operators of theaters in the world, was eager to fill a geographic gap between other theaters it operates, and in the process, eliminate or undermine a competitor.

Everyone here was flattered and relieved.

2) Only 25% of the center’s patrons are local residents, give or take a point, the same percentage of Americans in the nationwide Census who take in concerts and plays, something that hasn’t changed for more than a decade.

Having more and larger facilities does not generate more participation.  It just means it is spread thinner.

In Durham as a whole, 29.8% of the adult population attends live performing arts each year compared to the 24.9% attending popular entertainment such as concerts and clubs, which is right at the national average.

The former is less than a point higher than and the latter the same as Greensboro which recently visited Durham and announced plans to emulate our large-scale venue.

Wake County, which lost its Broadway series due to the startup in Durham, still draws only 1.2% fewer residents for performing arts overall and the same percentage as Durham to popular entertainment including concerts and clubs.

3) As a result, Durham’s large-scale venue is heavily dependent on day trip visitors for patrons, something made possible because the metro area it centers is near another anchored by Raleigh, North Carolina’s second largest city, which quickly shut down its touring Broadway series after DPAC opened.

But Durham visitors beyond 50 miles still don’t participate any more in the performing arts than they did prior to the opening of a large-scale venue.  Never has having more capacity changed the percentage of visitors interested in performing arts.

For any large-scale theater to succeed, it must draw visitors, including a good share who come to a community for other purposes.  Without being so close to a another major population center, Durham would be in big trouble.

But if the hundreds of communities that just built new large-scale venues are in the same predicament, something will have to give and usually that is a hollowing out of local arts creation.

4) Durham also negotiated a very favorable revenue sharing arrangement, supplemented by seat fees and special event parking fees in decks used.  What doesn’t show on that bottom line is tens of millions of dollars to relocate prior tenants and subsidies for nearby development.

5) Durham has a highly “accredited” community destination marketing organization known to be far more successful than its well funded counterparts and willing to try and defend smaller, more indigenous but equally valuable elements from bullying or erosion. 

Visiting officials also often fail to ask what Durham could or would have done differently, for example:

1) The center was apparently built on the cheap, forcibly in part, because initiators boxed themselves in with a tax funding formula to avoid voter and state scrutiny, thus, those extraordinarily long lines for the rest rooms.   The architect performed a miracle.

2) A pivotal opportunity was missed to weave the theater into the fabric of Durham’s “built” sense of place.

While there is a great view of ingredients to Durham’s sense of place from its spectacular glass lobby, it will likely be blocked by future development. The community missed an opportunity to make DPAC more “Durham.”

At the last minute, brick was added to the exterior at the insistence of the Mayor, but the building could have been designed coherent with its setting by picking up architectural details

Look, for example, at the National Historic Landmark just across a quad or either of the two surrounding National Historic Districts.  The interior could have been made to seem more temporal by using historic images of other theaters or performances here.

Or the new theater could have picked up the remarkable lines of the historic Austin-Heaton Flour Mill formerly on that site or evoked the beloved Durham Union Station that had stood across the track.

The design of the theater has grown on Durham residents but like the Detention and Judicial centers to the east, it isn’t coherent to its context.  As noted recently by one architectural expert:

“Cities have their own patterns of building, influenced by the pace of life, the quality of light, historic traditions or simply the materials available.

Buildings that acknowledge these patterns reinforce the sense of a particular place — they belong.”

Those on these inter-city visits, or inspection tours, also neglect to ask if the theater was a priority at the time or did it leapfrog higher cultural priorities?

They could also ask where Durham fell at the time in comparison to similar communities in the number of theaters or in overall visitor participation compared to averages.

Also questioned could be why philanthropic sources weren’t willing to fund the proportion of costs born in the other communities that were evaluated such as Greenville?  Was that a reflection of other community needs?

Was there any reason to build an additional performance hall prior to having a cultural master plan?

All of these questions go far beyond the questions usually asked during these familiarization tours and get at the overall question of “knowing what we know now, what would or could Durham have done differently” and still achieved similar or even better outcomes?

The problem, of course, is that to many people, questions are criticism.

Among those considering such a facility, anyone raising them might be ostracized as critics or naysayers because questions can be threatening to those who may have already made up their minds with very little information.

In turn, it is probably much too soon for even outspoken Durham to be introspective or if has, then forthcoming about what it would have done differently or volunteering that its success may have been been as much circumstantial as exceptional.

Regardless, history tells us that when provided such objectivity, enthusiasts have often dismissed it, even shopping around for consultants who would say yes after others concluded no.

It takes a truly exceptional community to put ego aside and pass up a challenge.

It took two or three decades after similar spates of overbuilding of other kinds of large-venue facilities before experts and researchers were able to truly and accurately assess the ramifications.

Even then there were outcries and choruses of angry denials.

Judging by studies and papers already underway such as the study “Is Bigger Better? The effect of capital facilities investment on non-profit financial vulnerability,” by Dr. Joanna Woronkowicz now under review.

Consortiums that began meeting under the aegis of Americans for the Arts nearly a decade ago, maybe those involved in the performing arts, will enlighten more quickly.

Or by then, will the devotees of such facilities as a means to achieve tangentially related but very different objectives such as “anchoring” turn to overbuilding yet another type of facility, hoping to feed what Architect Magazine columnist Aaron Betsky calls an “edifice complex?”

The history of such overbuilding over the last century suggests the latter.

Tuesday, September 02, 2014

7 Things To Look For In Feasibility/Impact Studies

Supply-side economic developers often latch on to tourism as a rationale for mega-facilities such as theaters, stadiums and civic/convention centers, even though that demand-side form isn’t remotely their forte.

They do this as a means to siphon off visitor-related taxes as a means of financing things that will avoid voter scrutiny, masking that the real purpose for the facilities is to prop up nearby private property values so as to better enable development.

Flattered to have tourism acknowledged at all, in some places, demand-side community destination marketing organizations have played along, or worse, failed to grasp the inherent supremacy of demand-driven economic development.

Fortunately, as was almost pathetically apparent recently at the 100th annual conference of DMO execs, this clique is a dying breed.

It is easy to find fault with feasibility consultants, who in a perfect world, should be brought in to do a needs and impact assessment unfettered by the “push and pull” agendas of advocates and local officials who have already made up their minds and only seek cover.

So increasingly, the ability to dissect feasibility studies both to keep them objective and as probing as possible, and then later, to further dissect reports for news outlets, concerned residents, neighborhood groups and any still-objective officials, is a requirement of being a demand-side DMO exec.

The importance of learning to fulfill this thankless task first emerged as a “best practice” nearly three decades ago (1985) when a handful of DMOs began to circulate a ground-breaking essay coining the term sense of place.  They also began to grasp the risks inherent in mega-facilities.

Central to what had become a movement a decade ago is the increasingly irrefutable mountain of evidence that if mainstream mega-facilities such as these are not proportional in scale and very delicately feathered into the ecosystem of what makes a community distinct, they rapidly hollow out its appeal.

Why does this responsibility fall to demand-side destination marketing organizations?  First of all, it’s because they must be intimate with sense of place to craft appeals to visitors, including more than 8-in-10 newcomers and relocating executives.

This also makes them, by default, responsible as the guardians of sense of place.

The second reason this responsibility falls to DMOs is that this is the organization in a community charged with spearheading overall visitation, including any portion necessary to pay off the debt on these facilities, as well as that which can be harvested by these facilities to make them sustainable.

Here are 7 things I learned to look for during my now-concluded four-decade career when assessing feasibility/impact assessments for mega-facilities:

Residential Burden from Visitor-related Taxes

Just because they are called visitor or tourist taxes does mean there isn’t a cost to residents and other local businesses.

This is far more than the small amount economists have identified through research that will be absorbed by the businesses collecting these taxes (e.g., lodging, prepared food, admissions, car rentals or special business districts’ property taxes.)

The impact is also far more than the visitors who will be lost at the margins due to the tax, something economists can also compute.

Far greater is the fact that any time a tax is assessed on a visitor, it subtracts from funds they have to spend in local businesses during the trip, an amount that adds up very quickly.  It can also be computed in advance during feasibility/impact analysis.

If spent on marketing to draw more visitors to a community, a visitor-related tax is offset by more than a 6-to-1 increase in visitors, and tax revenue generated from their spending that can offset the local tax burden through more visitor spending.

But when spent on debt service to finance a facility, that amount immediately leaves the local economy to pay off bonds.  Even the amount ineligible for marketing will still take away from availability to fund roads, trails, wayfinding, and the operation of other cultural facilities and events underwritten by local government.

The public has a right to know how much this will remove from the local business climate.

People who say financing something is painless because a visitor tax will pay for it may not realize it, but unless it is reinvesting in community marketing, they are deceiving local businesses and residents.

Insist On Estimates of Downstream Improvement Costs

Also beware of studies that cite the impact of similar facilities in other cities without showing the differences between what was projected by consultants on those projects and how hey have actually performed.

Studies should also reveal ongoing costs for renovation and upfit, which will ultimately far transcend the original construction costs.

An example is the Charlotte Coliseum.  It opened in 1988 but was demolished and replaced by another in 2007 before its original construction cost, $104 million in today’s dollars, had been paid off.

Now just nine years old, the newer $265 million facility is already in need of a $28 million upfit.  While a bit extreme, this example isn’t unusual for other mega-facilities there and elsewhere.

The downstream costs should be estimated in preliminary studies of feasibility and impact.

Don’t Settle Just For Estimated Activity

Be sure the study reveals three trend lines:

  • Percentage of visitor participation across the nation over time in the related activity as a proportion of overall visitation;
  • National estimates of the time Americans devote on average to the related category; and
  • Percentage of their income spent on that activity.

Economists know that these three factors rarely change over time.  They may keep pace with population but not capacity.  Time devoted to leisure today for example is the same as it was in 1900.  In fact, “pure leisure” has declined since 1965.

About 1-in-10 hours on weekends is available for events.

Instead, new facilities create a transfer or substitution within a category, e.g. leisure, not detectable in direct competitors but at more vulnerable levels.

This is why performances in non-profit theaters increased by 5,000 annually between 2004 and 2007, but attendance declined as the number of theaters doubled.

Often this effect is masked as it is in commercial touring Broadway shows where playing weeks and revenue increased during a similar span, but attendance, while up and down, is essentially what it was twenty years earlier.

This is why mainstream facilities are always a two-edged sword.  There may be a visible bump in participation, but the hollowing out at other levels that are even more distinct to a community’s identity are barely detectable, until it’s too late.

Most developers and related consultants dismiss this because many depend on “churn” to justify their developments.  But a community that ignores this is destined to lose its soul, if it hasn’t already.

A staggering number of cultural facilities were built in the United States between 2000 and 2007, especially performing arts centers, and yet the percentage of visitors participating in and/or prompted by these events along with overall attendance remained flat.

The index for ticket sales to commercial concerts increased from .73 to 1.38 driven by the 5% of performers who are driving 90% of concert revenues.  But it was flat to slightly down when compared to the index for capacity.

Good studies for a new theater, for example, should show not only how capacity has increased overall through the years but that the percentage of adult Americans attending various types of concerts collectively over the past decade has been flat to down at 22%.

Yet of the nearly $16 billion spent by communities on 725 new cultural facilities between 1994 and 2008, most were spent on performing arts centers during just five years between 1999 and 2004.

Look Carefully At Trend Lines

A decade is not enough to spot decline.  For example, a chart of the last 15 years for attendance at conventions will show only a valley, a peak and a slightly lower valley.

Some consultants for convention centers add a trend line at the end going straight up.

But to see the long, slow decline in this segment of visitation requires zooming out to at least 1974.  Suddenly, it becomes clear that over the past three decades, both the valleys and peaks gradually each became lower and lower than those past.

Of course, conventions and meetings are still an important visitor segment, but any community looking at a convention center must also ask to see the corresponding trend line for the number of groups using convention centers.  This is about 30%, broken down further by cohorts of average size by both overnight and daytrip, e.g. 80-85% are 2,000 or fewer in size.

Charts should also overlay a trend line for capacity, showing the more than doubling of convention space during that decline as well as the explosion of major convention hotels with meeting space.

Durham and Raleigh are a case study of comparison.  The former built what we call a “boutique convention center” as the decline became apparent, while Raleigh erected a mega-convention center several years ago.

Yet during the five years they have co-existed, Durham and Raleigh have continued to draw the same proportion of overall visitors to each community who attend conventions, with Durham actually exceeding Raleigh during some years in the proportion attending other types of meetings.

Similarly, Durham opened a new performing arts center during that period—its twelfth—which supplanted one in Raleigh for touring Broadway and other performances.

Yet, this has not decreased the proportion of visitors to Raleigh who take in that activity or changed the proportion of residents so inclined in either community.

Mega-facilities increase supply, but not necessarily demand.  Those that succeed are often due to anomalies.  Make sure feasibility studies detail downside risks beyond those that are merely financial.

Beware Of Including Resident Impact

Research economists uniformly disregard resident spending as part of a facility’s economic impact.

This is not only because a new facility will result in a transfer, or substitution of leisure time use and spending rather than an increase.  It is also because residents would have been spending the same amount of discretionary income somewhere else in the economy if not there.

Still it isn’t uncommon for downtown advocates or local officials to shop for consultants until they find one that will inflate projected impact by including residents.

This may because downtowns have a win/lose inferiority complex born of years of neglect, but it may also have to do with adopting the “churn” mentality of some developers.

But anyone credibly evaluating a feasibility study should back out resident spending or show it merely as “economic contribution” but not value-added.

However, a growing trend is to try and compute “retained tourism” which is “locals willing to travel” for similar events but because of the proposed facility, will now keep that spending local.

We attempted to calculate it in Durham for facilities during the last decade.  It must be customized to each community because “locals willing to travel” will fluctuate greatly on how close or far away alternative communities and facilities may be.

It is a legitimate calculation if very carefully done based not on conjecture, but sound research.  Of course, as with visitor impact, this should distinguish between attendees prompted by events from those who take them in on trips for other purposes.

New Visitors Attributable To Vs. Required For A Proposed Facility

Consultants usually make an attempt to quantify the number of visitors who will travel for the main purpose of taking in events at a proposed facility either in lodging room-nights or admissions or car rental days or meals, versus those who may happen to take in events during trips for other purposes.

But it is just as important to also make sure there is a calculation of how many additional visitors the destination overall will be required to draw to make up the amount needed to pay for the facility either by direct subsidy or from revenues fueled into government coffers.

A good estimator will suggest, based on this calculation, a corresponding increase a community should simultaneously invest in community marketing to generate this increase in visitation.

A good performing arts venue hosting a mix of concerts and touring Broadway productions may generate up to 15,000 hotel room-nights from cast and crew, which to officials, may seem like a lot.

But remember that the tax is paid on the rate paid for the room, not the room itself.

Even for a destination such as Durham, where rates are the highest of its comp set, this means that such a facility will generate less than 1% toward a debt service requirement of $1.5 million.

So good business dictates an increase to overall community marketing of $250,000 to $500,000 annually to generate the rest of the revenue needed.

ROI

A good feasibility study won’t just calculate the raw impact of a facility but also the return on investment to local government from non-resident visitor spending.

This should be net the cost of the land and any costs related to relocating existing businesses or services as well as the cost of construction.

This will include taxpayer return on investment from any parking and concessions or revenue-sharing.

Local governments are notorious for accounting practices that make it difficult to trace revenues related to expenses but especially beyond just operations.  A study might go so far as to recommend a special account to do this.

The ROI should include related visitor spending broken down by prompted vs. those taking in the event on trips for other purposes as well as the induced value added to the economy.

The best practice economic model will also calculate unavoidable “leakage” specific to a community; e.g., supplies that must be ordered from vendors outside the community.

It should also make it practical for a community to institute policies and metrics that encourage use of local vendors and the hiring of employees who live in the community or otherwise deduct that from the impact of the facility.

A “best practice” community destination marketing organization can re-calculate these numbers annually using the same model.

In summary, communities that value the importance of sense of place not only for appeal to visitors and new business relocation or expansion, but also for resident attachment and passion should carefully evaluate any proposal for mega-facilities.

Preservation of sense of place and community revitalization require strategic decisions as much or more about “what not to do” as they do about “what to do.”

Those most appealing in the future will be communities that learn to say “thanks but no thanks.”
Friday, June 14, 2013

The Failure to Link “Buy Local” to ROI

There were two conditions I had to meet before I could participate in my first roundup on the cattle ranch that had been homesteaded in my native Idaho by my paternal great-grandparents and grandparents and then run by my parents.

First, I had to graduate from drying the dishes after dinner to taking a turn from a step stool at washing them.  Second, I had to get past my fifth birthday.  I eagerly achieved both goals.

This year, the overall cattle herd in the United States is the smallest its been since 1952, the year before my inaugural roundup when our population was half what it is today.

Ours was a small, independent family operation.  Our 500 head of cattle were range-raised, grass-fed and free of the low-dose antibiotics so controversial today because when ingested as food, it lowers our response to those drugs when we need them.

The livestock cattle we grew were “Shorthorns,” ironically a breed improved from cattle that were namesaked for Durham, England, a sister-city to my adopted home of Durham, North Carolina.

In 1946, two years before I was born and as my parents were acclimating after my father’s return from serving in the 35th Tank Battalion, some of the first studies were documenting the importance of independent, locally-owned businesses like the ranch.

My now-concluded career helping to grow local business climates may have even been inspired by watching my parents run that ranch.

I was disappointed, but not surprised, when the American Tobacco Complex in Downtown Durham, which has been boosted by nearly $100 million from Durham taxpayers, elected recently to import a Raleigh restaurant to handle its event catering here, a snub that will be felt by many living in Durham, “The South’s Tastiest Town.”

This move essentially exports not only all of the catering revenue out of this local business climate but also many ancillary purchases such as equipment rentals and related economic impact into another business climate…the one where the owners are based.

Being successful at business is no guarantee of a grasp of the fundamentals of community economic development.

Many communities such as Durham fail to build “buy local” stipulations into agreements when they incentivize developments.  In some cases they may have their hands tied from doing so by state legislation, further undermining the very fundamentals of community economic development.

Even when they could have, officials and advocacy organizations often act instead as another developer-friend put it recently “like a desperate tween with an ‘oh-my-god-I-could-die’ crush who considers his/her world near-over when the object of desire doesn’t text back in 10 seconds.”

Also playing a role in this failure to connect the dots could be the decision-making by those who now hold two out of three jobs in Durham but don’t make this community their home.

One of the breakthrough studies validating the importance of buying local was conducted about the time I was born in the late 1940s by Dr. Walter Goldschmidt, a UC Berkley-trained sociologist and anthropologist attached to the Bureau of Agricultural Economics of the United States Department of Agriculture.

His study found that all else being equal, small or mid-sized ranches and farms like my family’s promoted higher quality rural communities than large farms and livestock growers.  A similar study at about the same time found that smaller businesses had the same effect on manufacturing communities.

According to Stacy Mitchell of the Institute for Local Self Reliance (ILSR,) under the sway of large agribusinesses, USDA officials actively suppressed Goldschmidt’s analysis and Congress ignored the study on manufacturing businesses, much like “desperate tweens” I suppose.

Goldschmidt, who later taught and researched at UCLA passed away in 2010 at age 97.  Coincidentally, our paths would cross again during my career in community-destination marketing when I was stationed in Anchorage, Alaska beginning in 1978.

He had also conducted the research that informed the 1971 Alaska Native Claims Settlement Act that paved the way for the Trans-Alaska Pipeline which had begun operation a few months before I arrived there.

The challenge for Alaska and Anchorage has been to leverage the impact of those developments into greater economic self-reliance.  That has meant buying local as a means to expand capacity and reap a full share of economic impact.

They had to learn stand up to Seattle just as Durham has had to stand up to Raleigh in order to foster a stronger local business climates and tax bases.

A few months ago, ISLR published its 6th annual Independent Business Survey with data gathered from nearly 2,400 independent, locally owned businesses across America, employing more than 37,000 people..

Half are retailers and half are a mix of service providers such as banks, farms and ranches, manufacturers, restaurants, wholesalers etc.  Two-thirds have five or fewer employees while only five percent have 50 or more.  This is much truer to small business than the federal government definition.

According to the report, places such as Durham with a grassroots “buy local” initiative saw these businesses grow more than two and a half times the rate of those elsewhere.

The survey found that “showrooming” was a significant challenge to independent, locally-owned businesses.  This is where people window-shop in local stores but buy later online.  Financing is still an issue as well.

But a major issue is that policies such as corporate subsidies, tax loopholes, and others give unfair advantages, or even fail as Durham did with American Tobacco, to connect the dots about the importance of using local businesses as part of its return-on-investment to the taxpayers.

As more and more communities pursue sustainability and the triple bottom line, it will be essential to also connect the dots for economic developers and officials about the importance of independent, locally-owned businesses.

Wednesday, May 29, 2013

12 Disruptive Technologies by 2025

An economic impact analysis has just been published for 12 disruptive technologies that McKinsey Global Institute projects will begin to transform not only how we live and work but the economy over the next twelve years.

For a brief description of what makes a technology worth tracking as disruptive, click on this interview with Google executive chairman Eric Schmidt.

The McKinsey analysis entitled, Disruptive technologies: Advances that will transform life, business, and the global economy is fascinating and filled with interesting tidbits.  One is that 2-3 billion more people will access the Internet by 2025.

Reading that, It struck me as ironic that those in high office who are most boastful  that America is providentially exceptional, something with which I agree to a point, are the same ones restricting the expansion of broadband access in this country.

Gridlocking infrastructure investments such as this will pull us far behind other countries creating a sort of “excluded-ism.”

Mindful of that, maybe that’s why my attention was drawn in particular to two of the disruptive technologies in the report, energy storage and renewable energy.McKinsey 12 Disruptive Technologies

Many of us see rapidly advancing energy storage in terms of adoption of hybrid and electric vehicles (55% of new cars could be plug-in hybrid by 2025) but according to the report, rapidly advancing storage technology will also soon bring electricity to a billion people who don’t have it.

This isn’t included in what could be a $635 billion annual impact by 2025.  However, that amount does include the boost that improved battery storage will bring to the efficiency and quality of the electric grid while reducing emissions of CO2.

While one of the disruptive technologies in the report is the 100-200% efficiency increase in our ability to wring the last drop of fossil fuels from the earth, it is heartening that renewable energy also makes the list.

The cost of a watt from solar cells has dropped by 85% since the year 2000.  Renewables are being adopted “at scale” in the US and EU and soon in China and India.  The report makes projections based on two scenarios, one that trends breakthroughs and another with “technology frozen at current levels.

Fossil fuel devotees conveniently forget that this energy source has been heavily subsidized over the decades and continues to be today by refusals to adopt full-cost accounting, not only of exploration costs but the cost of shipping, military escorts and to the earth’s inhabitability.

Several scenarios in the report factor in various levels of subsidies for development of renewables as well as net those out of economic impact estimates while adding in estimates of the value of reduction in CO2 emissions.

The interrelated dynamic today of fossil fuel technologies and renewable energy technologies is creating an interesting but conflicting environmental narrative.

As the report notes – “The shift from coal to gas for electricity generation is reducing greenhouse emissions while simultaneously leaching urgency from the drive to develop renewable energy sources.”

In North Carolina, where I live, there is an interesting scenario underway.  Republicans control the Governor’s office and both houses of the General Assembly.

Some, such as Republican Representative Chuck McGrady, still have conservation bonafides, having also been national president of the Sierra Club.  Many however are true to form to this skit by comedian Steven Colbert.

Colbert, who grew up and still has a vacation home in neighboring South Carolina devoted a skit to North Carolina lawmakers who tried to legislate projections for sea level change. As Colbert notes, “…this is a brilliant solution.  If your science gives you a result you don’t like, pass a law saying the result is illegal.  Problem solved.”

The skit is well worth viewing as Colbert provides humorous examples of applying the logic of Republican lawmakers to things such as longevity.

Republicans here are also advancing a prior Democratic tax reform proposal that shifts tax burden from corporate and individual income tax to a sales tax broadened to more equitably include many more types of purchases not only by individual consumers but businesses.

At the time, the sales tax rate would be reduced.

Another comedian, Dr. Yorum Bauman, aka “the world’s only stand-up economist” gives a funny but insightful TED presentation on why a “revenue neutral” carbon tax is a tax reform upon which many Republicans and Democrats, Conservatives and Liberals and both climate-change skeptics and believers can find common ground.

He explains that the basis of such tax reform is to “tax what we want less of…instead of things we want more of.”  Bauman notes an experiment that lawmakers such as those in North Carolina should study closely.

The Canadian province of British Columbia is gradually increasing a tax on carbon, while offsetting it with reductions to taxes on individual and business income.  North Carolina could expand the reductions to include sales tax.

At a federal level in the US, a similar approach would lower individual and corporate income taxes, reclaiming offshore sheltering while providing much needed revenues for infrastructure and R & D into disruptive technologies while reducing climate change.

In B.C., the arguments about the carbon tax policy have gone from “fur or agin” to how to increase its application and whether to use it all for tax reduction or for other uses that will meet the goal.  Links in this paragraph cover several different perspectives.

In this country, those obsessed with contempt for taxes and government are caught up in the futile and counterproductive attempt to starve out waste, starving even the enforcement efforts intended to ferret it out.  In turn, this also forces a counter-reactionary response to program loss rather than waste reduction.

Lose, lose, lose.

As Bauman notes, the B.C. approach is win, win, win because it taxes what we don’t want – pollution – and reduces taxation on what we do want – income – which will “promote innovation, conservation and development of new technologies.”  Sounds more like capitalism than the approach in the paragraph above.

It is amazing what can be done when we find common ground.

Thursday, February 28, 2013

Negative Link Between Campaign Donations & Shareholder Value

The reason many in business and government are skeptical of research is that many of them use “pimped opinion” as a substitute, and so they find it hard not to assume everyone else does.  Especially lobbyists.

Part of content curation such as I do with this blog and that I practiced during my now-concluded 40-year career as a community-destination marketing (DM) exec is to look carefully behind a study to make certain it was produced and vetted by experts and if possible peer reviewed.

Of particular concern are so-called white papers often promoted by partisan think-tanks where even more careful scrutiny is always warranted.

The DMO in my adopted home of Durham, North Carolinas has earned a reputation for objective analysis based on sound data.  This should never be taken for granted.  It can be lost in heartbeat if not deeply entrenched in organizational culture and governance and insulated from anecdotal whimsy.

Last November, purposely held I assume until after the election, an excellent peer-reviewed study was published by Harvard law professor John C. Coates who specializes in corporate law and governance (shown in this blog.)

His study found “in most industries, political activity correlates negatively with measures of shareholder power, positively with signs of agency costs, and negatively with shareholder value.”

The exceptions are businesses such as outdoor billboard companies, where any value is wholly reliant on governmental decisions and regulations regarding tax payer-funded roadways and other government-dependent industries such as defense or those heavily regulated in the public interest such as utilities.

If the failure of massive injections of anonymous corporate donations into the election process wasn’t enough to confirm that these dollars were an unwise wise investment, Coates’ data added an emphatic exclamation point.

Highly threatened, the U.S. Chamber of Commerce (not to be confused in any way with local chambers of commerce) immediately dusted off a long-discredited white paper that had never been peer-reviewed and was produced by non other than a lobbyist.

Unfortunately for too many casual observers, this meant “touché, all over again” and a “tie goes to the runner,” right?  Fortunately, Professor Coates opened up with both barrels in a letter this month to the Securities and Exchange Commission.

Coates’ findings undermine a pivotal assumption by the Supreme Court in Citizens United.  Hopefully, SCOTUS justices have time to read and not just write.  Regardless, the Coates study should be required reading for corporate shareholders and all C-suite executives.